The standard deviation is a statistical measure used to describe the variability or spread of a data set. It is one of the most common and useful measures to understand the distribution of data and its relationship with the mean.
The standard deviation is calculated as the square root of the variance. Variance is the measure of how much individual values deviate from the mean. A higher standard deviation indicates that the data is spread more widely around the mean, while a lower standard deviation indicates that the data is more clustered around the mean.
The importance of the standard deviation is that it provides an objective measure of the variability of the data, which allows us to compare the dispersion of different data sets and make accurate inferences about the population from a sample.
For example, if you wanted to compare the performance of two different sports teams, the standard deviation could provide an objective measure of the variability in each team’s results. If one team has a much higher standard deviation than the other, then it can be inferred that the team’s results are more variable and less predictable than the other team’s.
Additionally, the standard deviation is a key component in constructing confidence intervals and statistical hypothesis testing, which are important tools for data-driven decision making.
Standard Deviation Formula
The mathematical formula used to calculate the standard deviation is as follows:
σ = √(Σ(xi – x̄)² / N)
where:
- σ is the standard deviation
- Σ means “sum of”
- xi are the individual values of the sample
- x̄ is the sample mean
- N is the sample size
The formula is made up of two parts: the numerator, which measures the variability of the data, and the denominator, which adjusts the value to account for the sample size.
The numerator refers to the sum of the squares of the deviations of each individual value from the mean, and the denominator refers to the number of values in the sample minus one.
To calculate the standard deviation, the following steps must be followed:
- Calculate the mean of the data.
- Subtract the mean from each individual sample value and square the result.
- Add the squares of the deviations.
- Divide the sum of the squares of the deviations by the sample size minus one.
- Take the square root of the result obtained in the previous step.
For example, if you have the following sample: 10, 15, 20, 25, 30, the standard deviation would be calculated as follows:
- Calculate the average: (10 + 15 + 20 + 25 + 30) / 5 = 20.
- Subtract the mean and square: (10 – 20)² = 100, (15 – 20)² = 25, (20 – 20)² = 0, (25 – 20)² = 25, (30 – 20)² = 100.
- Add the squares of the deviations: 100 + 25 + 0 + 25 + 100 = 250.
- Divide the sum of the squares of the deviations by the sample size minus one: 250 / 4 = 62.5.
- Take the square root of the result: √62.5 = 7.91.
Therefore, the sample standard deviation is 7.91.
It is important to note that the standard deviation is a measure that is sensitive to outliers or extremes in the sample, which can influence the result. Therefore, it is important to consider the presence of outliers when interpreting the results obtained.
Interpretation of the standard deviation
The standard deviation is a measure of dispersion that indicates how much the values in a sample vary from the mean. A high standard deviation indicates that the sample values are more spread out, while a low standard deviation indicates that the values are more concentrated around the mean.
Therefore, a high standard deviation may indicate that the sample has greater variability or dispersion, which means that individual values differ significantly from the mean. On the other hand, a low standard deviation indicates that the values are closer to the mean, suggesting less variability or dispersion.
The standard deviation is also related to other statistical concepts, such as the mean and median. When the data distribution is symmetric and unimodal, the mean, median, and standard deviation are closely related to each other. In a symmetric distribution, the mean, median, and mode are equal, and the standard deviation is a useful measure for understanding the variability of the data around this central measure.
On the other hand, in a skewed distribution, the mean, median, and mode may differ from each other, and the standard deviation may be a less adequate measure to describe the variability of the data.
Here is an example of how the standard deviation relates to the mean and median in different types of data distributions:
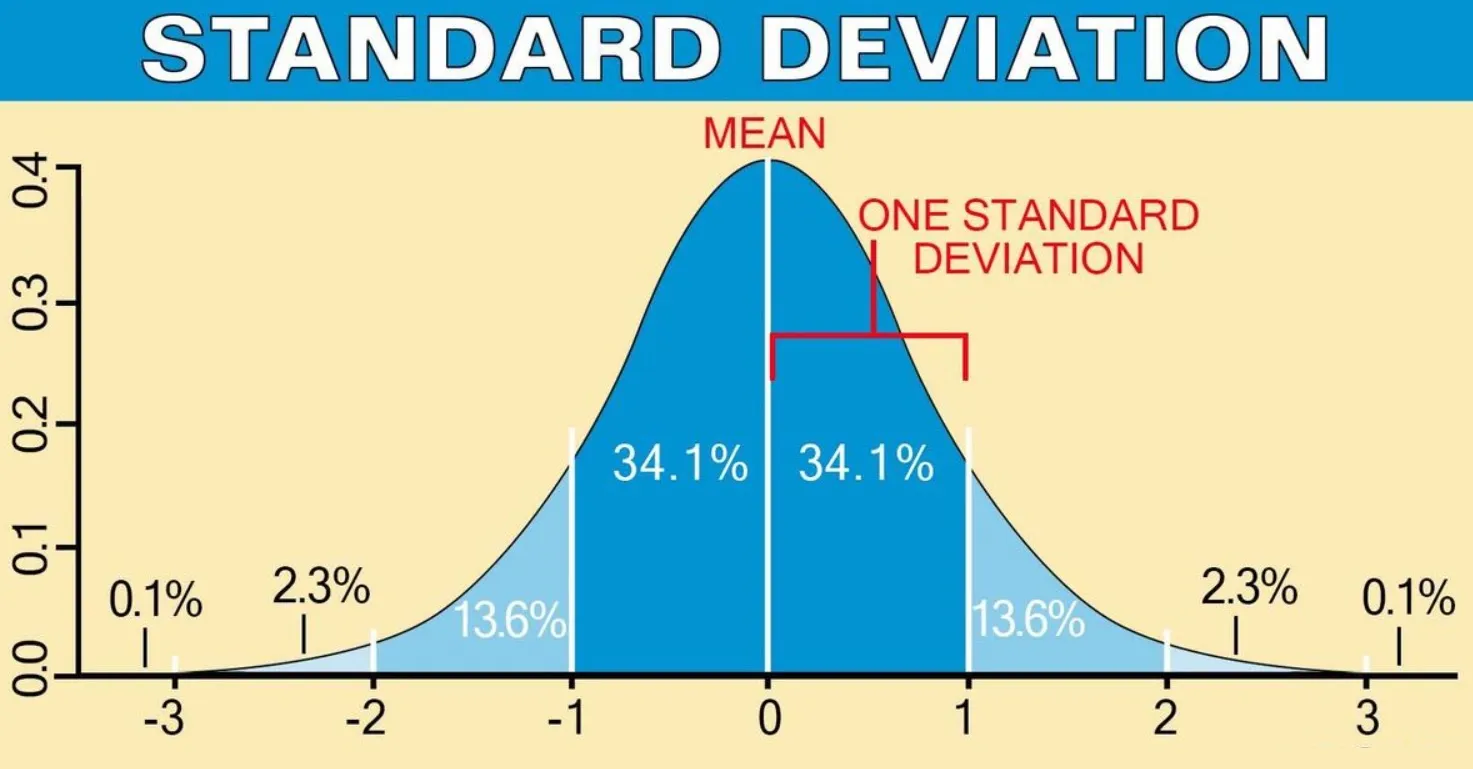
In a normal distribution, the mean, median, and mode are equal, and the standard deviation is a useful measure for understanding the variability of data around the mean.
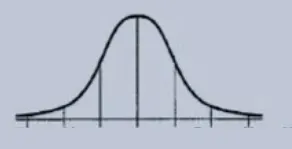
In a right-skewed distribution, the mean is greater than the median and mode, and the standard deviation may be less useful in describing the variability of the data.
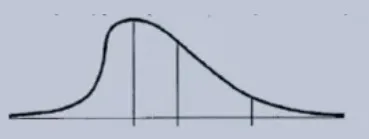
In a left-skewed distribution, the mean is less than the median and mode, and the standard deviation may be less useful in describing the variability of the data.
Practical examples
The standard deviation is used in a wide variety of fields and real situations, here are some practical examples:
- Financial markets:The standard deviation is a measure commonly used in risk analysis in financial markets. For example, in the stock market, the standard deviation of a stock’s returns can be used to measure the volatility or risk associated with that stock. A high standard deviation value would indicate that the returns of that stock have greater variability and, therefore, greater risk.
- Scientific Research: The standard deviation is a useful tool for understanding the variability of data and measuring the precision of results in scientific research. For example, in a clinical study, the standard deviation can be used to measure the variability in the results of different groups of patients or to determine if the results obtained are statistically significant.
- Quality control: The standard deviation is also an important measure in quality control, in which it is used to measure the variability in the production of a product or service. For example, an automobile manufacturing company may use standard deviation to control for variability in bolt length on a specific automobile model. A low standard deviation would indicate that production is within tolerance limits and therefore in control.
- Survey Analysis: The standard deviation is a useful measure for analyzing survey data, especially when you want to measure the variability in responses in a sample. For example, in a public opinion poll, the standard deviation can be used to measure the variability in responses to a specific question, which can help identify areas where respondents have the most divergent opinions.
Helpful Hints on How to Calculate Standard Deviation
Here are some tips and recommendations that may be useful for those who want to apply the standard deviation in their work or research:
- Good understanding of the concept: It is important to have a good understanding of the meaning and interpretation of the standard deviation before applying it in any statistical analysis.
- Know the limitations: The standard deviation is a useful measure, but it is not the only one. It is important to know the limitations and strengths of this measure, and to consider other statistical measures to gain a full understanding of the variability of the data.
- Pay attention to the sample size: The standard deviation can be influenced by the sample size. It is important to consider the sample size and keep in mind that a small sample size may result in a standard deviation that does not fully reflect the true variability of the data.
- Use statistical analysis tools: Statistical analysis tools such as Excel or R can make it easier to calculate the standard deviation and its interpretation. Learning to use these tools can save time and reduce the risk of miscalculation.
- Understand the context of the data: The standard deviation must be interpreted in the context of the data. Therefore, it is important to understand the context and nature of the data, as well as the purpose of the statistical analysis.
- Use graphs: Graphs can be a very useful tool for visualizing data distribution and variability. It is recommended to use graphs in conjunction with the standard deviation to obtain a complete understanding of the data.
- Be critical of the results: It is important to be critical and evaluate the results obtained through statistical analysis. Reviewing the assumptions, checking the validity of the conclusions and considering possible sources of error are important to guarantee the quality of the results.
I hope these tips and recommendations are useful for those who want to apply the standard deviation in their work or research. Remember that practice and experience are the best way to improve your statistical skills.
Do you have any questions or problems related to the topic of the article? We want to help you.
Leave a comment with your problem or question. We read and respond to all comments, although sometimes it may take a while due to the volume we receive. Additionally, if your question inspires the writing of an article, we will notify you by email when we publish it.
*We moderate comments to avoid spam.
Thank you for enrich our community with your participation!